New OptiFiber Pro High Dynamic Range Modules for Outside Plant and Passive Optical Networks
October 31, 2018 / General, Standard and Certification, Installation and testing, Industrial Networks
With the new Fluke Networks OptiFiber® Pro High Dynamic Range (HDR) Optical Time Domain Reflectometer, Versiv becomes a single solution for applications ranging from FTTx, PON and datacenters to category-rated structured cabling. Since Versiv users report that its efficient and familiar interface cuts costs by 65% when testing, certifying and maintaining copper and fiber network installations, it’s clear why they’d want to apply the same savings to outside plant jobs as well.
Three new Singlemode Modules are available (all feature an APC port and a removable SC adapter that can be switched for others such as LC)
- OFP-200-S-MOD (1310, 1550 nm)
- OFP-200-S1490-MOD (1310, 1490, 1550 nm)
- OFP-200-S1625-MOD (1310, 1550, 1625 nm)
These modules are compatible with any OptiFiber Pro or Versiv model and support the most commonly used SM wavelengths for OSP applications. For example, Fiber to the Home (FTTH) works over a single fiber using 1310 nm wavelength for upstream data transmission, 1490 nm for downstream data transmission, and 1550 nm for television. And since it’s not typically used for transmission, 1625 nm can be used for troubleshooting without interfering with a live PON network. The longer 1550 and 1625 nm wavelengths are more affected by bends in the cable, which makes them useful for finding them. (More on that later.)
Why High Dynamic Range?
|
ANSI/TIA-568.3-D Appendix D Splitter Loss Values |
|
|
Split Ratio |
Loss |
|
1 x 2 |
3.9 |
|
1 x 4 |
7.3 |
|
1 x 8 |
10.7 |
|
1 x 16 |
14.1 |
|
1 x 32 |
17.5 |
Passive Optical Networks (PON) use optical splitters to connect to multiple end devices. In most cases, the splitter breaks the signal into n equal signals, where n is a power of two, and each resulting signal power is 1/n of the original. So in a 1:16 splitter, each signal is 1/16 of the original. Each halving of the signal results in a 3 dB reduction of the signal strength so, a -10 dBm signal going into this splitter would emerge as 16 signals, each with a strength of -22 dBm. Actually, there is a little bit of loss in the process of splitting, so the actual drop in signal strength is a little greater as expressed in the table of maximum acceptable values at right.
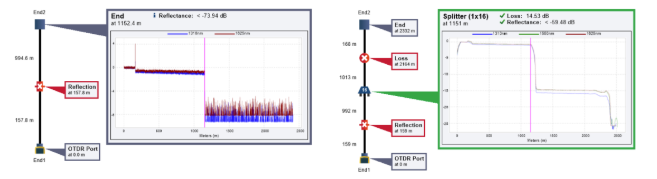
If testing through a large 1:128 splitter, there is a huge difference (nearly 30 dB) between the input signal and the resulting output signal. This large insertion loss is a challenge for an OTDR such as the OptiFiber Pro, which is designed for short distances and small dead zones that are useful in a typical data center. With a dynamic range of 30 dB, the signal that reflects back from beyond the splitter is so small the OTDR can’t really see anything.
That’s why the High Dynamic Range modules feature a range of 40 dB or better, allowing the OTDR to see what is actually happening beyond the splitter. In the examples below, the trace at left can’t really see what’s happening on the fiber after 1152 meters, so it just assumes the cable ends there. The one at right has a higher dynamic range (note the vertical axis), and can see the signal continues after the event at 1151 meters, but is about 13 dB less – which is about what would be expected from a 1:16 splitter.
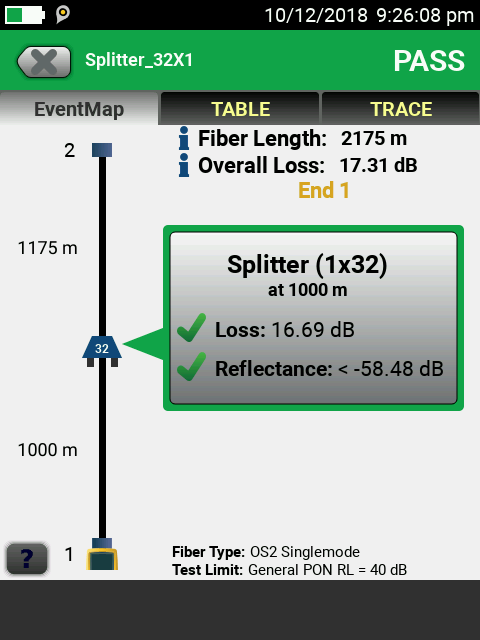
OptiFiber Pro Makes It Easy
Now, you can always impress your friends by analyzing traces, but OptiFiber Pro users are spoiled by the EventMap™ that does the complex work of interpreting the trace for you and providing a diagram of what’s on the cable. The new HDR modules continue that tradition with the ability to display a splitter in simple graphics on the display at right. This lets you get your work done faster, and if you want to impress your coworkers with your trace analysis skills, just touch TRACE on the display to instantly switch to the that view.
The OptiFiber Pro HDR also features an Auto PON mode which analyzes the fiber and then sets pulse width and averaging values to give you the best view. From here, you can apply your expertise to adjust these values – a feature we’ll cover in a later post.
See how splitter detection works in this video: https://www.youtube.com/watch?v=vKKo0bqF1A4
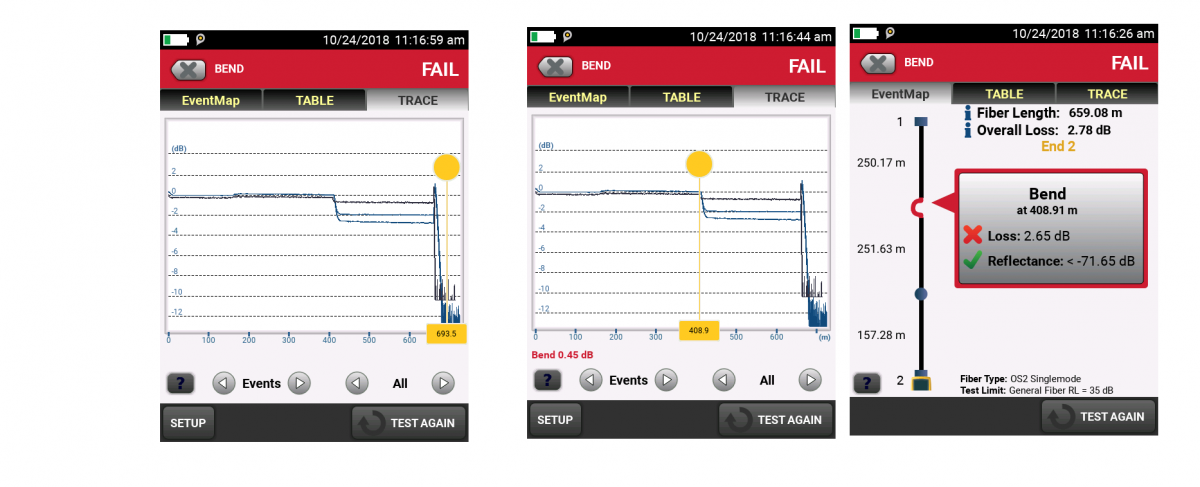
Curing the Bends
We noted above that the longer wavelength light is more susceptible to bends in the fiber. You can see an example of how that plays out in the OptiFiber Pro trace below. The light at 1625 nm shows significantly more loss than that at 1310 or 1550. (Take my word for it - on the actual product, you can step through the individual wavelengths with the left and right arrows in the lower right corner of the display.) Again, an OTDR expert can tell you this, but now the OptiFiber Pro can as well, as in the lower right display. Looks like someone might have closed a vault door on that fiber! You can see a live demonstration of bend detection at: https://www.youtube.com/watch?v=Kjh7ebdR-4Q