2021 Network and cabling salary survey results
April 28, 2021 / General, Industrial Networks
For the third year, Fluke Networks has teamed up with Cabling Installation and Maintenance to survey network and structured cabling professionals about salaries and jobs. This survey gathered data on the areas that impact salary, like education and experience. We also asked about types of jobs, bonuses, job changes, and how COVID-19 impacted the workforce. In addition, this survey includes information on salary by job titles like network technician salary, network engineer salary, cabling general management salary, and network designer or architect salary.
As you’ll see below, there are some significant and surprising departures from findings of prior years – it may be that the pandemic disrupted so many businesses and livelihoods also had unpredictable affects on pay.
Table of contents
- COVID-19
- Salary by job title
- Type of compensation
- Workforce factors that impact salary
- Age vs experience
- Education and certifications
- Specialty
- Unions
- Regional pay differences
- Job changes
COVID-19
This survey was conducted toward the end of 2020, so at the time questions were answered, we were well into the changes caused by COVID-19. While this survey also covers the same areas asked about in previous years, addressing how the workforce was hit by the pandemic is a large factor in the data for the year’s survey.
In 2020, 61% of companies experienced reduced hours, furloughs, layoffs, or reduced contract hours. Breaking that down further, of those companies that had to undergo some cost cutting measures, 34% turned to reduced hours, 27% furloughed employees, 30% saw layoffs, and 34% reduced contract hours.
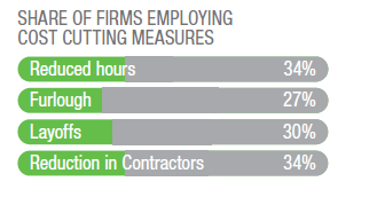
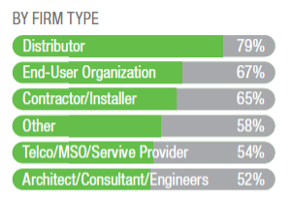
The share of firms employing cost-cutting measures shows they saw reduced hours, furloughs, layoffs, and reduction in contractors. Many firms saw these cost-cutting measures with distributors at 79%.
The actions companies had to take in order to stay afloat impacted the individual workers throughout the year. 23% of workers experienced those cost-cutting measures. Technicians took the largest share of reduced hours, furloughs, layoffs, or reduction in contractors with 30% being affected.
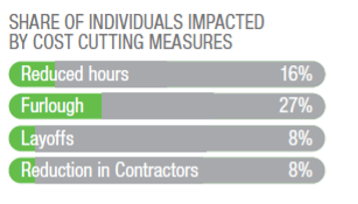
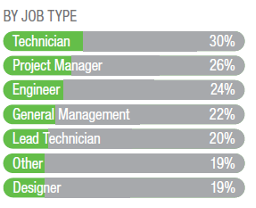
Furloughs were the most common cost-cutting measure used by network and cabling companies. And during the pandemic, technicians (30%) and project managers (26%) were most impacted by cost-cutting measures.
Compensation by job title
Survey respondents reported a 9% average compensation increase over the previous year.
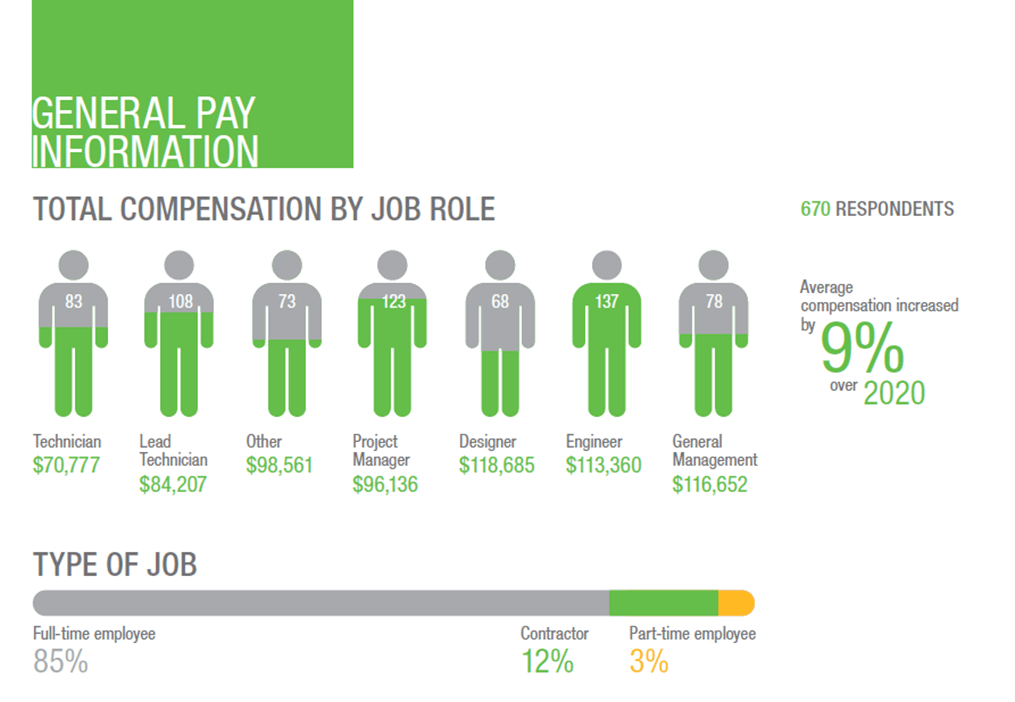
The last survey Fluke Networks conducted only saw a 2.7% salary increase over the first survey conducted.
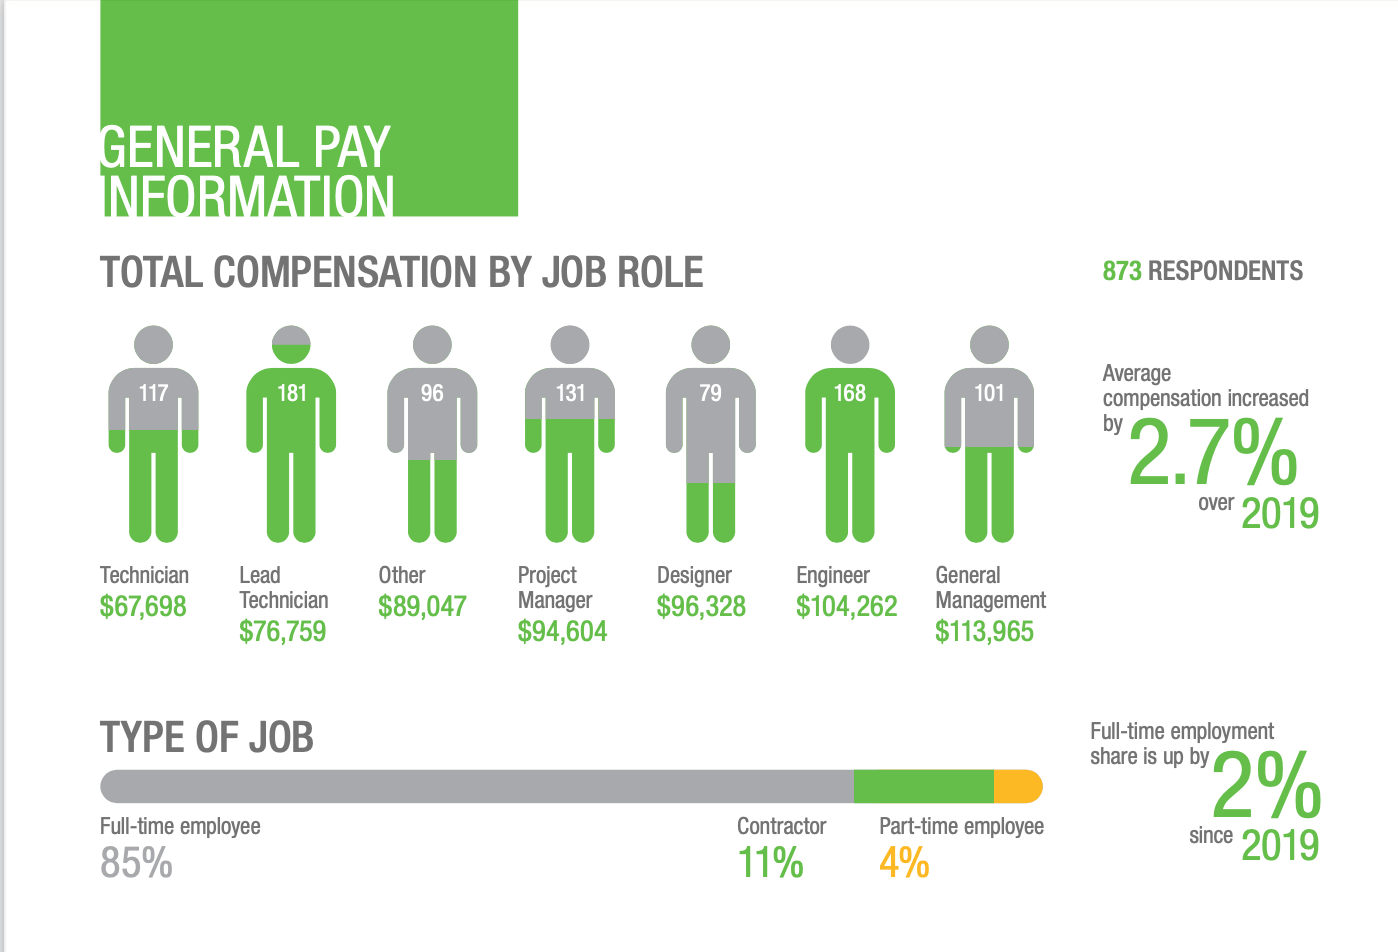
Network technician salary
The average network technician salary in the United States is $70,777 per year in early 2021. Network technician salary rose from $67,698 to $70,777 in 2020. When surveyed in at the end of 2018, technicians reported they made $68,475. Of the job titles surveyed, technicians were the only group to report a decline in their salary over the past three years. This group saw a dip in 2020, but overall increased about 3.4% over the first year of survey data.
Network technicians includes fiber optic and cable technicians. Their average hourly wage is $29.69. This places technicians at the bottom of the list of compensation by job role. When a technician advances to lead technician, on average their salary will increase $13,430 or 19% to $84,207. The average hourly wage of lead technicians is $33.05.
About 80% of technicians are paid an hourly wage with the remaining 20% paid salary.
About 47% of network technicians earn a bonus. The average bonus is 2% of their pay, or $1,488. About 28% of lead technicians earn a bonus. The average bonus is 16% of their salary or $13,292.
11% of technicians report being likely to leave for a new company, ranking them second by job role, only behind network designers or architects.
Network lead technician salary
Lead technicians made a little bit more than their technician counterparts, clocking in at $84,207. This group has reported a salary increase every year since this survey began. Last year, network lead technicians said their salary was $76,759.
Network project manager salary
Project managers have also reported a salary increase from each year this survey has been conducted. Those with this job title made $96,136 in this 2021 survey. Last year, those with the same job title made $94,604, up from $90,811 the year before that.
Network designer or architect salary
Network designers have seen the largest salary growth over the last three years. Starting at $99,778 in 2019, the most recent survey revealed network designer salary at $118,685.
Network engineer salary
Network engineers reported a salary of $113,360 when surveyed for our 2021 data. In 2020, the respondents said they made $104,262. And in the 2019 survey, the network engineer salary was $100,801.
Cabling general management salary
The salary for general management has increased steadily over the years. Starting at $109,227 in 2019, increasing to $113,965 in 2020, and in our most recent survey, cabling general management salary is at $116,652.
| Technician | Lead technician | Other | Project Manager | Designer | Engineer | General Management | |
| 2021 | $70,777 | 84,207 | 98,561 | 96,136 | 118,685 | 113,360 | 116,652 |
| 2020 | $67,698 | 76,759 | 89,047 | 94,604 | 96,328 | 104,262 | 113,965 |
| 2019 | $68,475 | 75,475 | 86,906 | 90,811 | 99,788 | 100,801 | 109,227 |
Type of compensation
For each of these groups, whether they receive overtime or not can make a large difference in their take home. Take a look at the charts below to see the percent of hourly respondents by job title as well as what the average hourly wage is for each title.
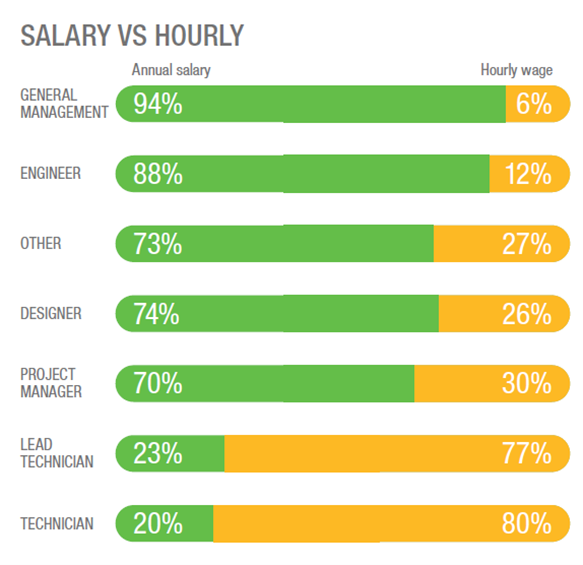

More than half of the general management, engineers, designers, and project managers who responded report being salaried employees.
General management is 94% salaried, but the 6% of hourly employees with this title make an average of $42.87.
Engineers are also mostly salaried employees, the 12% who receive hourly wages make an average of $47.68/hour.
Designers come in at 26% hourly, making the highest average hourly amount at $52.71.
70% of project managers are salaried employees, but the 30% who are hourly make an average of $41.97.
The average tips at the lead technician and technician job titles. 77% of lead technicians are hourly employees making $33.05. While 80% of those with the job title technician are hourly, making $29.69.
Workforce factors that impact salary
Age vs experience
Demographic information that impacts salary include areas like experience, age, education, certifications, specialty, union membership, region, and job changes. Diving further into this section of the 2021 survey, we saw a direct correlation between age and increase in pay. Staying in the industry into your 60’s can lead to a 176% increase in salary.
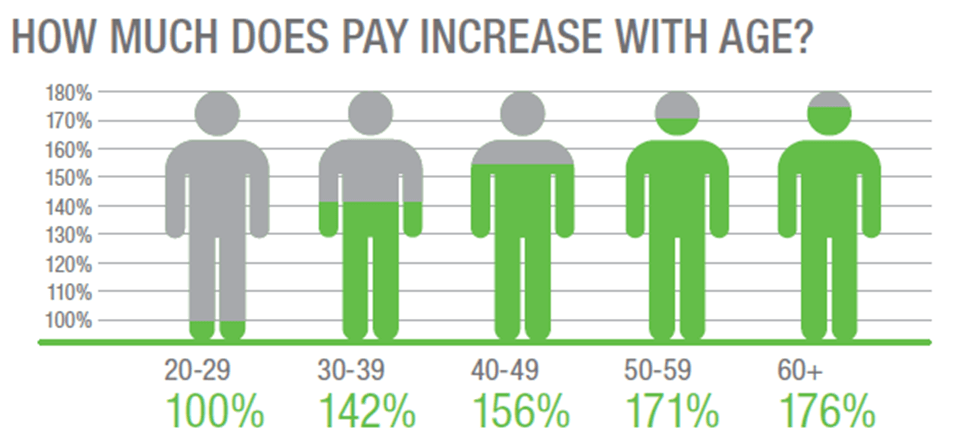
Salary increases with age, with more dramatic increases from 20-40. After that, the increases plateau, ending with those 60+ earning 176% of their starting salary.
Experience didn’t see the same direct correlation or increase in pay. For the first 20 years of work, there is a small, but steady increase in pay. After you hit that 20-year mark, there’s a large percentage increase, a 23% pay increase, but after that milestone, the increases slow and are almost flat through the 30-year mark.

For the first 20 years in the industry, pay increases more drastically, then plateaus and even drops a bit through the next 20 years. Individuals with 20-24 years of experience earn 160% of their starting salary, while those with 35-40 years of experience earn 159%.
Education and certifications
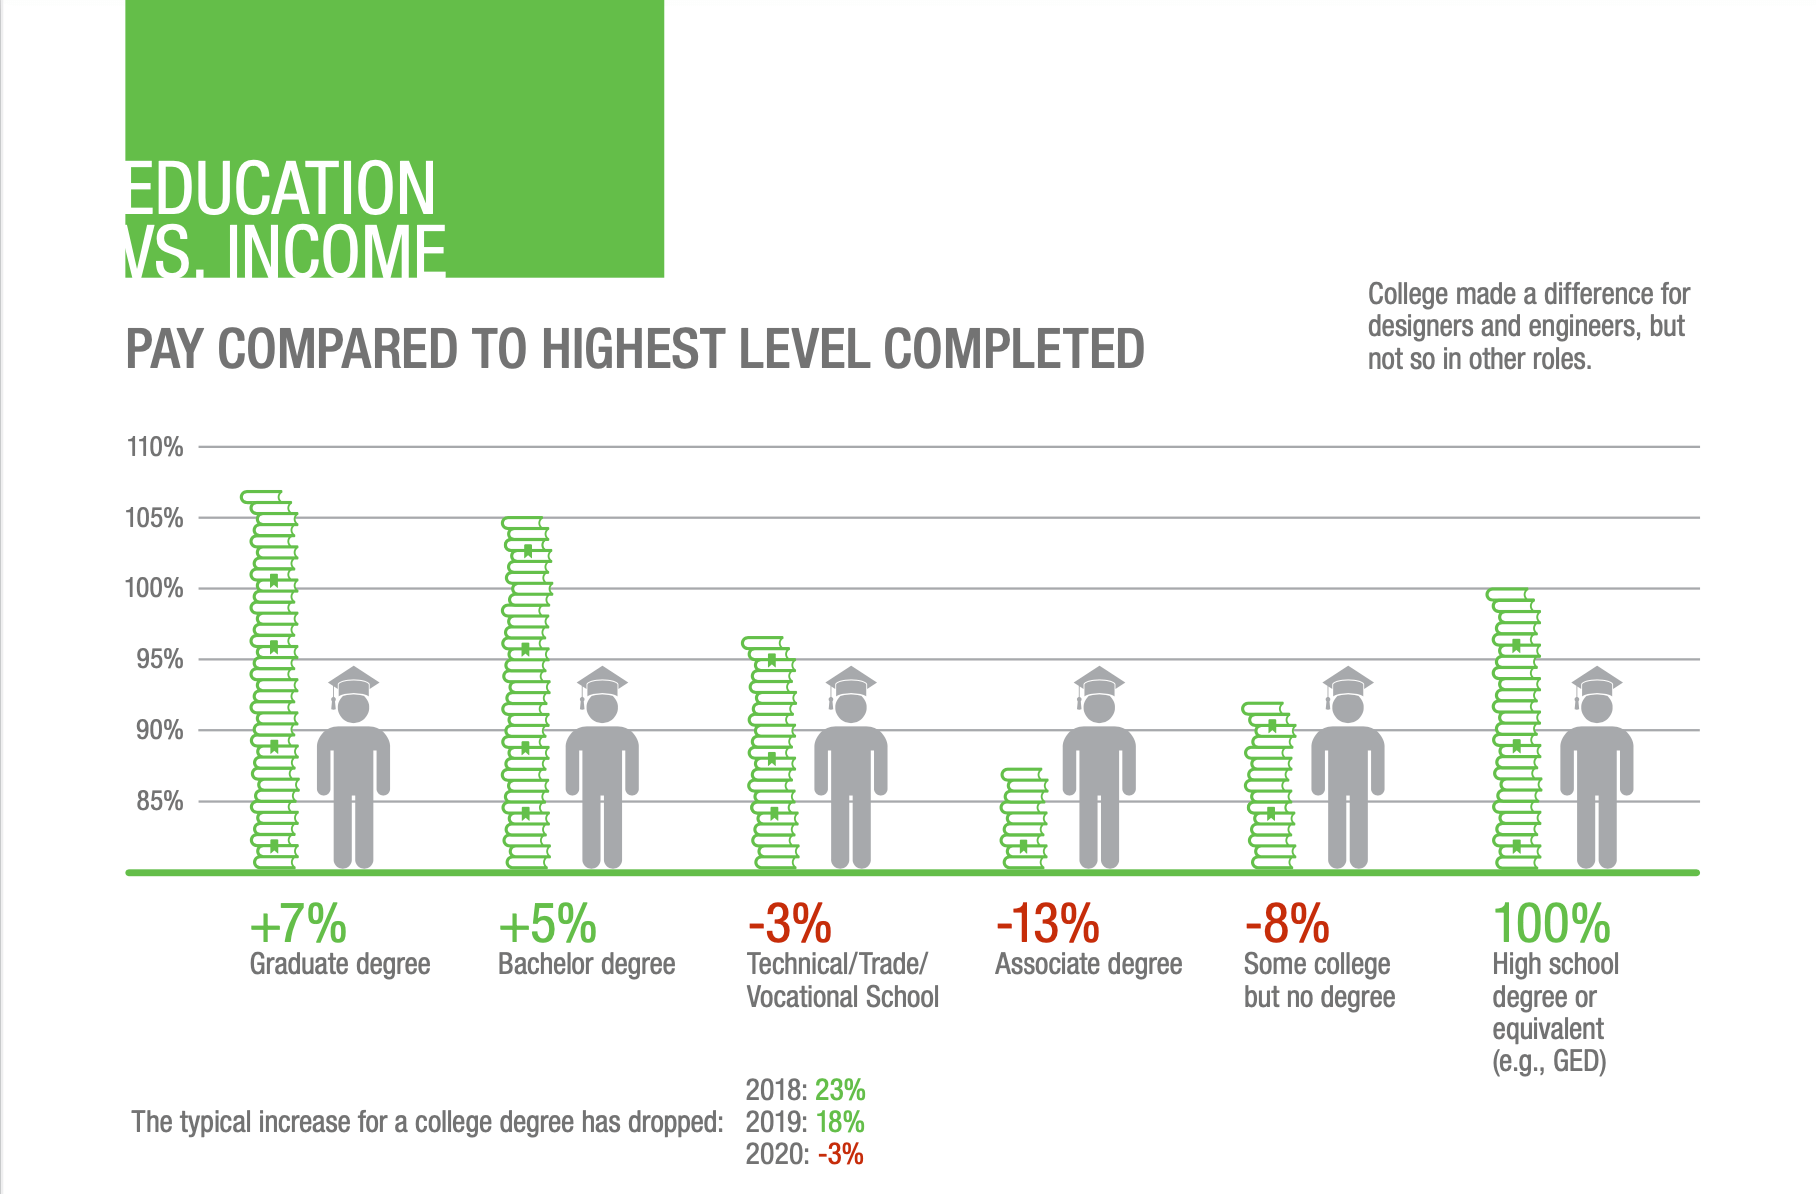
The highest education level did see a difference in the amount of pay an individual received, mainly for the designers or engineer roles. If the employee had at least a bachelor’s degree, they saw a 5% increase in pay compared to having only a high school diploma or equivalent. If the individual continued on to get a graduate degree, they saw a 7% increase over highs school education.
Roles with titles other than designer or engineers did not see as much of a lift from continued education.
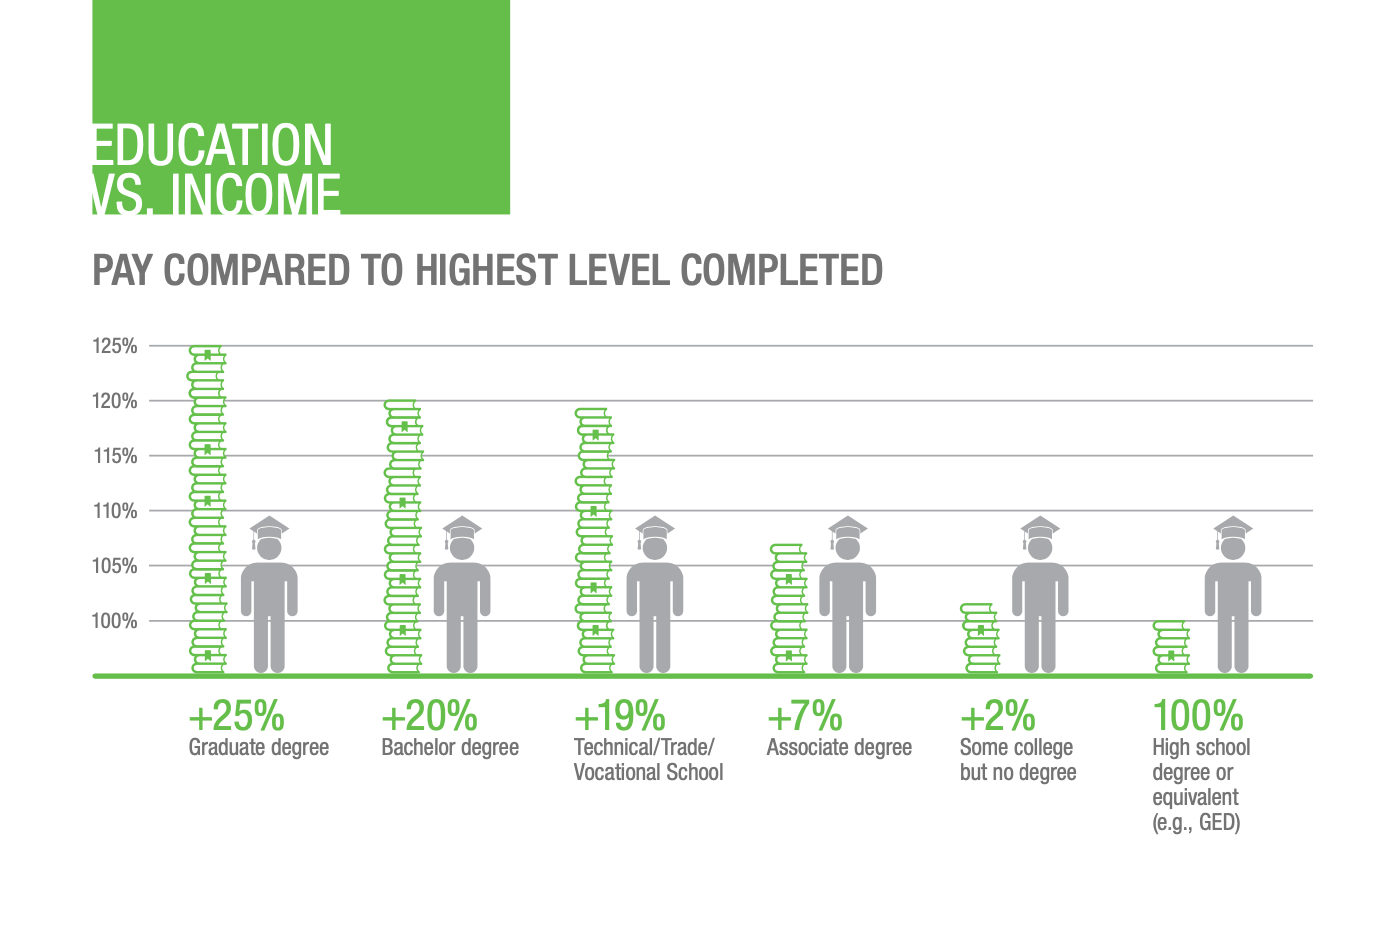
In the 2020 salary survey, respondents' education level versus income completed created a much different chart. Any additional education past the high school level led to an increase in salary, but this year saw a change. That typical increase for a college degree has dropped. While the amount of salary increase has declined since we began this survey, this is the first year the results have shown a decrease. In 2018, the industry saw a 23% increase, in 2019, an 18% increase, and in 2020 a 3% decrease.
Certifications also made a difference in pay. Individuals who completed the BICSI Registered Communications Distribution Designer (RCDD) eared 24% more than those who hadn’t received the certification. And in a similar pay differential, technicians who were Fluke Networks Certified Cabling Test Technicians (CCTT) earn 22% more than non CCTT-certified technicians. Learn more about our CCTT program here.

BICSI RCDD and Fluke Networks CCTT certifications help individuals earn 22-24% more in their careers.
Specialty
Depending on the specialty, both for the firm an employee is working for, or specialization within their own education, an employee can see a lift in their salary. Certain sectors, like data centers, financial, and healthcare, create a higher demand and can increase average pay. Working in data centers can create a 12% increase in salary over some other areas. However, working in K-12 education or residential sectors see a lower pay than the average.

Some sectors offer the highest pay, like data centers, showing a 12% lift over other sectors.
Individual employees reporting they have a high level of expertise in a specific specialty do see a variance in pay compared to those with no expertise in that specialty. The chart below shows the top paying specialties, Internet of Things (IoT), and data center installations seeing the highest difference with 16% and 10% increases, respectively.
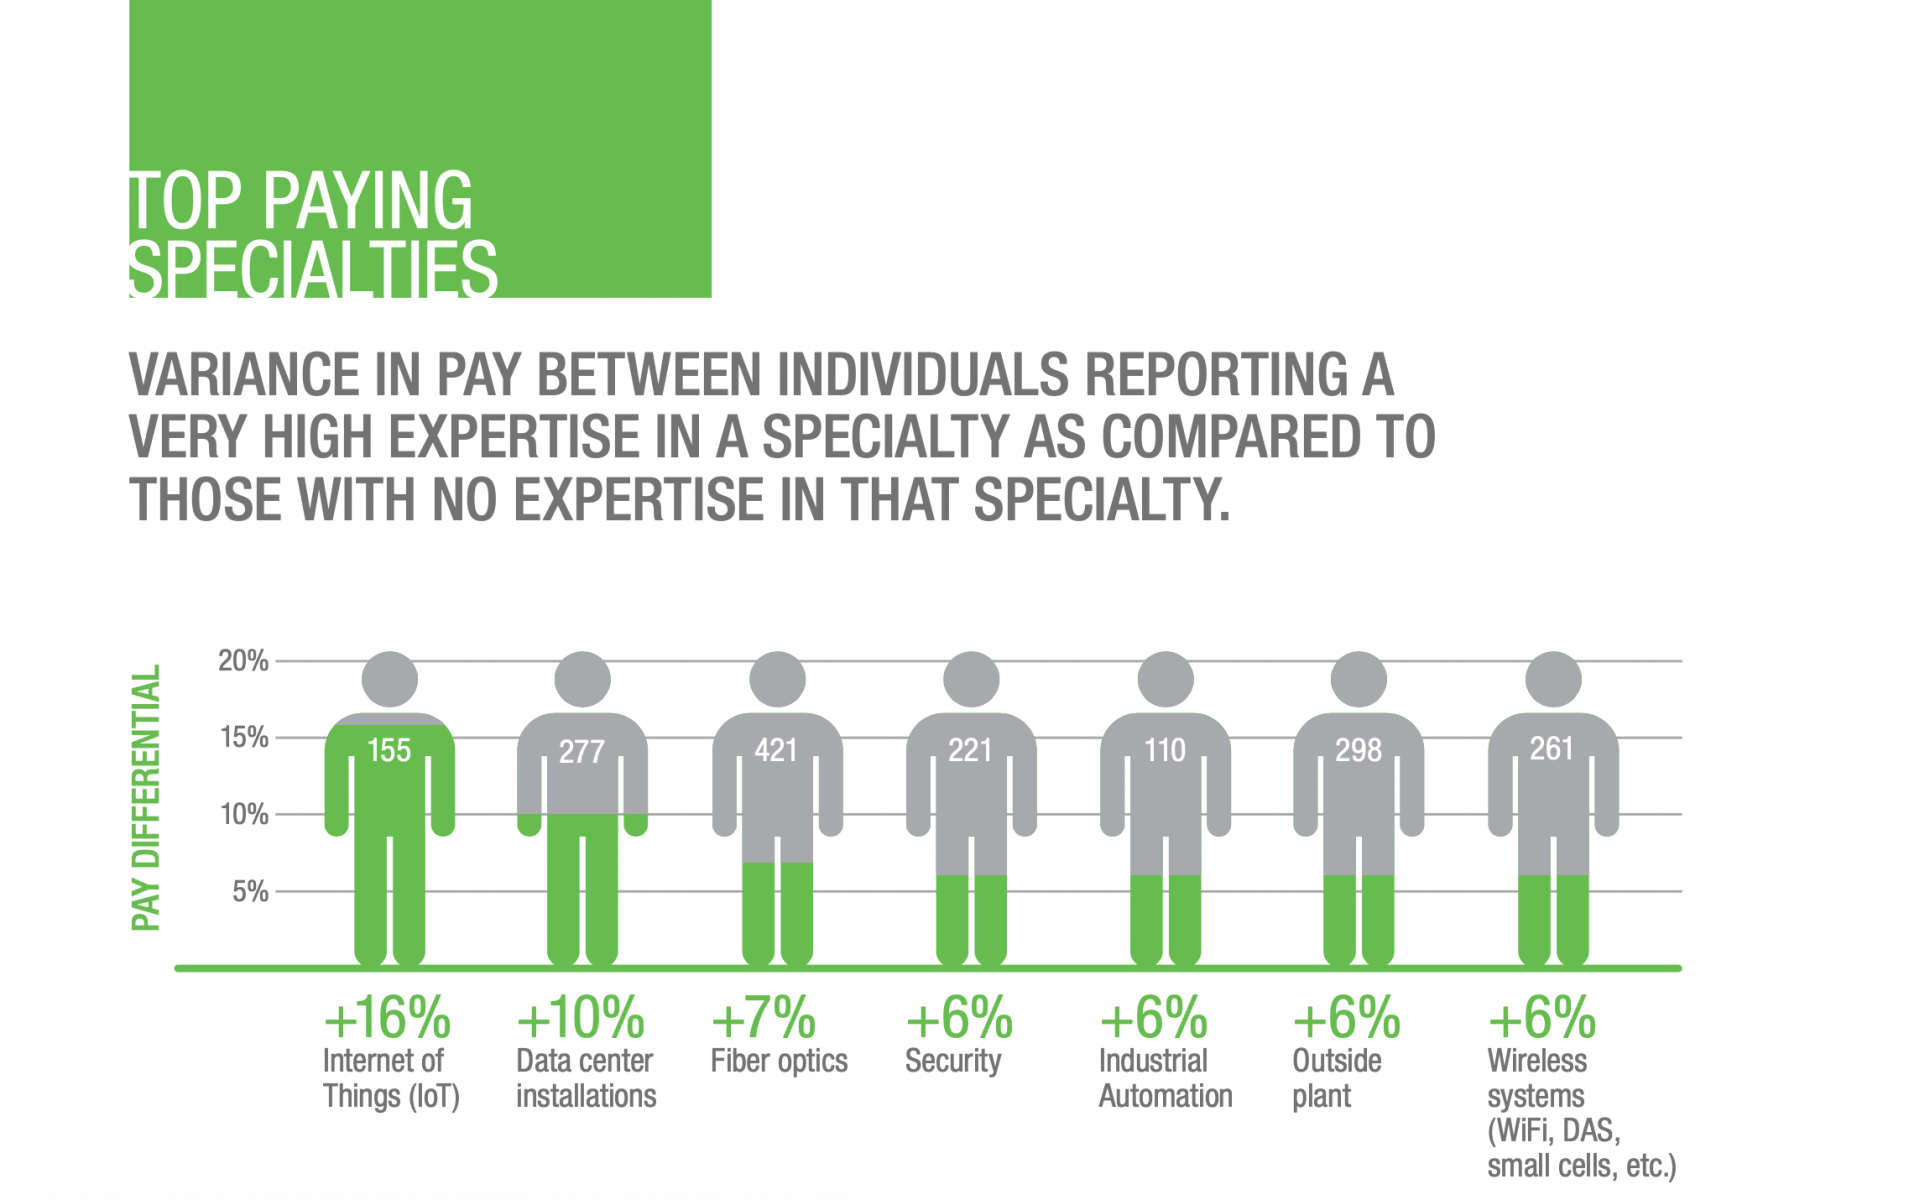
Respondents said having a high expertise level in a specialty shows an increase in salary.
Unions
Union membership makes a difference in overall earnings. Union members earn an average of 14% more than non-union members, but the amount varies by job. Below you’ll see a comparison chart of pay between the 96 respondents who are union members and those who are not. Unionized engineers saw a 28% increase in pay, lead technicians saw a 27% increase, technicians come in with a 25% increase, project managers get 24% more than their non-union counterparts, and designers see a 5% increase in how much they earn. However, employees in the general management area decrease their salary by 39% when they worked in unionized organizations.
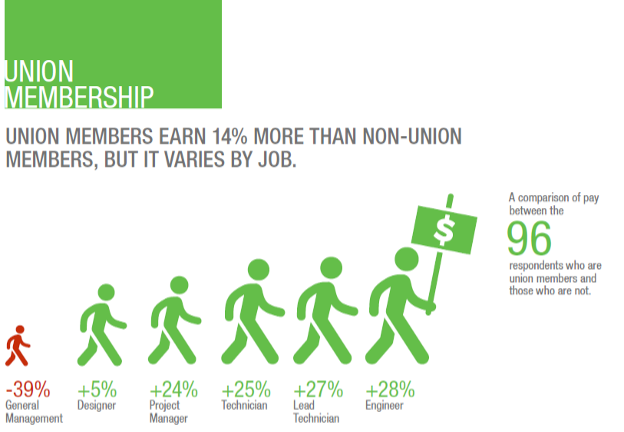
Union members earn 14% more than non-union members. Some job titles, like general manager reported a decrease in salary (-39%) while others reported more than a 24% increase.
Regional pay differences
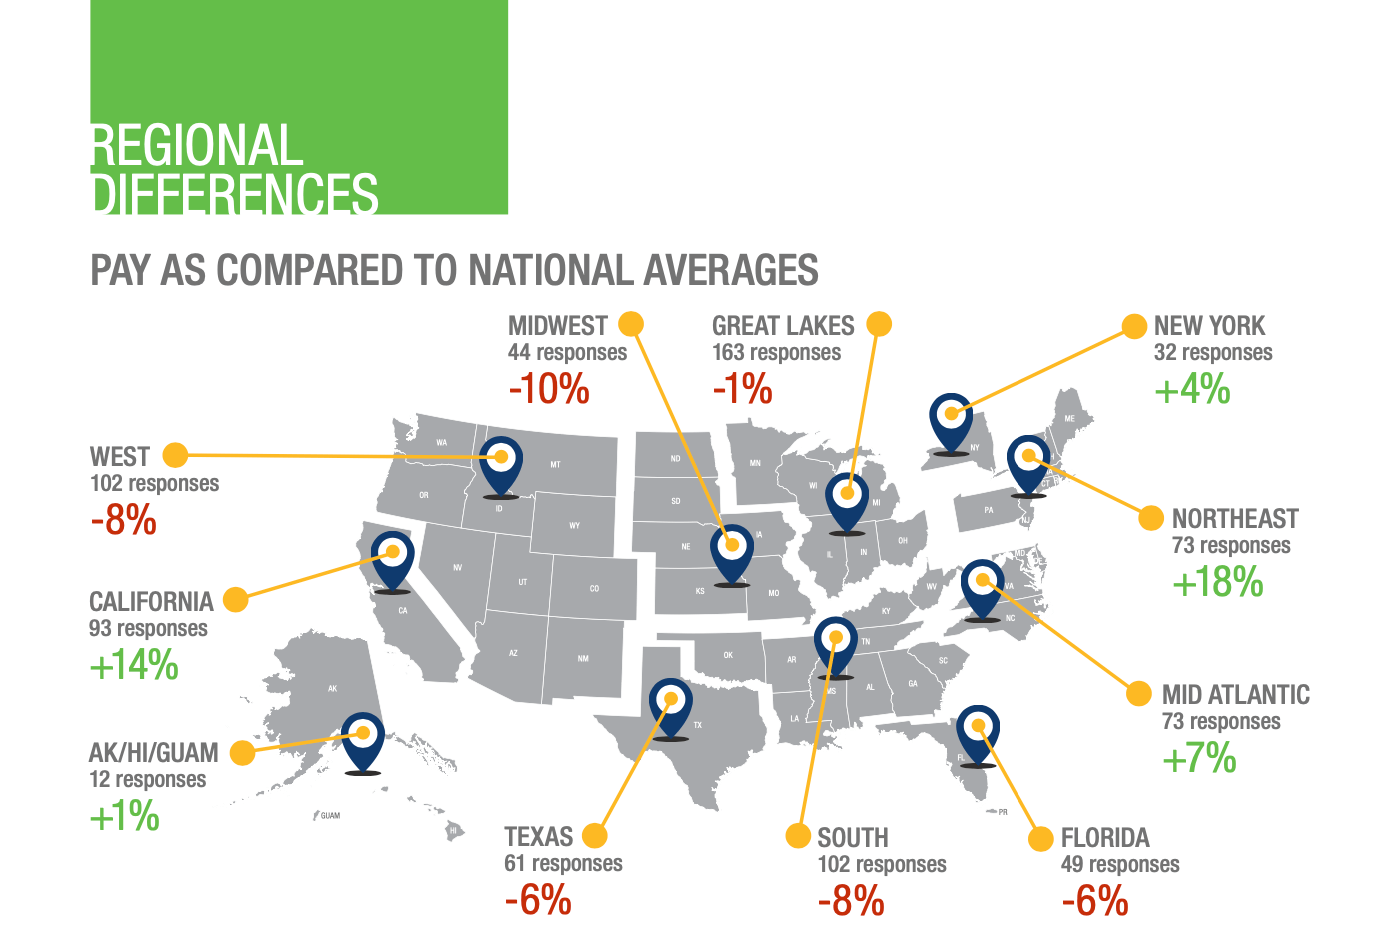
Where you live makes a difference in how much you make. The majority of the country remained static in the amount made compared to the national averages. The Midwest and South remained insulated, seeing no change year over year.
Alaska and the West saw the largest changes. Alaska workers were paid 1% above average in the previous survey, but this time around, they were reported at 15% below average. The West went from 8% below average in 2019 to being 3% above average in this survey.
The Northeast and California also saw a decrease in the amount pay as compared to national averages between the years. Both still remain above average, but the amount above average is closing. The Northeast was at 18% above average in 2019 and only 2% above average in 2020. Meanwhile California was 14% above average and respondents reported pay at only 5% above average in 2020.
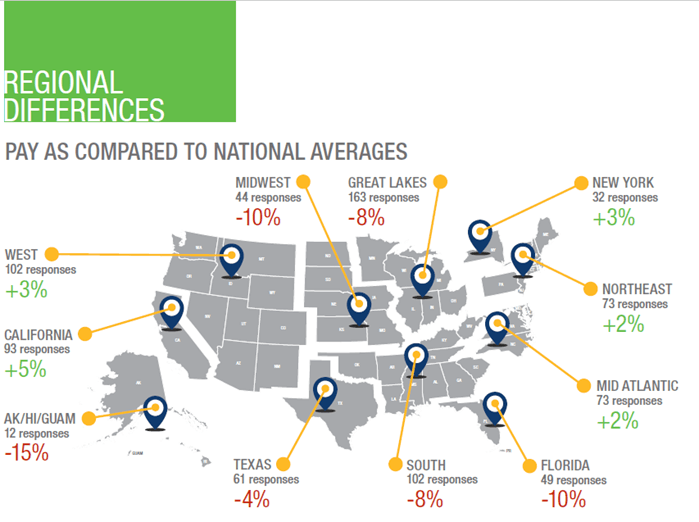
In 2021, regional pay is above average in the West, California, New York, Northeast and mid- Atlantic. It’s below average in Alaska, Midwest, Great Lakes, Texas, South, and Florida.
In 2020, Regional pay is above average in the California, Alaska, New York, Northeast and mid- Atlantic. It’s below average in the West, Midwest, Great Lakes, Texas, South, and Florida.
Job changes
Due to the number of firms affected by the pandemic and cost-saving measures, the number of respondents who changed jobs remained surprisingly similar to previous years. In 2020, more individuals stayed in their current jobs; 9% of respondents changed employers, down from 12% the year before. Respondents who reported changing employers in the 2021 survey, said they were earning 6% less than those not changing. In the previous survey, those individuals reported making 9% more by changing employers.
The job title that saw the opposite response was designers. In this years’ survey, designers were the most likely to leave their current job for one with a new company. Those who did leave and begin jobs with new companies were able to increase their pay by 15%.

3% of respondents changed jobs at the same employer, 5% started a new job at a new employer, and 4% took the same job at a new employer in 2021. In 2021, designers were the most likely to leave for a new company at 14%.
Keep learning
Download each year’s full survey story for more information.
Advance your career with the best tools
See Fluke’s leading line up of network and cable certification, installation, and test tools that can help you do your job right and advance your career.


