Cable Testing 101: How to Read the LinkWare™ PC Report
November 10, 2016 / General, 101 learning, Installation and testing, Best Practices

In our last 101 Series Blog, we took at closer look at everything in blue at the top of your LinkWare Report. But what if your customer wants you to explain the detail and those pretty charts to the right?
Let's dive deeper so you're prepared for that possibility.
Critical Values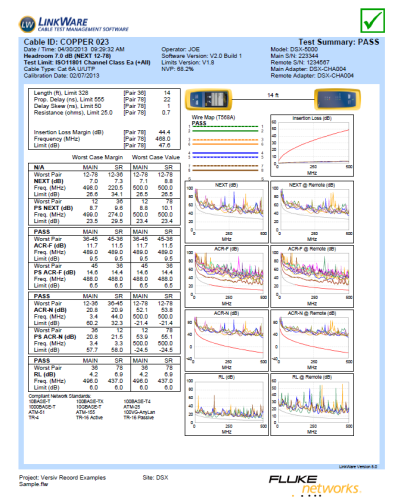
The section just below the blue area on your report shows the wire map test and a boxed-out area with critical values for the cable under test. These include the length (displayed in feet or meters depending on what the user selected), propagation delay, delay skew, resistance and insertion loss margin.
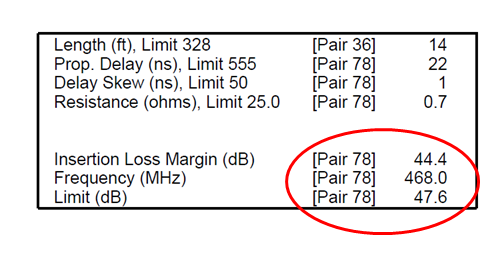 The detail of the insertion loss margin can be seen in the insertion loss graph to the right, and it includes the margin based on the worst pair, at what frequency and the test limit for that frequency.
For example, this report shows that the worst case margin for insertion loss occurred on Pair 7-8 at a frequency of 468 MHz with a margin of 44.4 dB below the limit of 47.6 dB--not too shabby but not surprising for a short 14 ft. cable length.
The Detail
The rest of your LinkWare report shows the worst case margins and worst case values for the worst pairs and at what frequency they occurred and detailed graphical results for Near End Crosstalk (NEXT), power sum NEXT (PSNEXT), attenuation to crosstalk ratio, far-end (ACR-F), power sum ACR-F (PSACR-F), attenuation to crosstalk ratio, near-end (ACR-N), power sum ACR-N (PSACR-N) and return loss (RL).
Depending on the test limit selected, the test might also include parameters that indicate balance and alien crosstalk performance, such as transverse conversion loss (TCL), equal level TCTL (ELTCTL), common mode to differential mode NEXT (CDNEXT) and common mode return loss (CMRL).

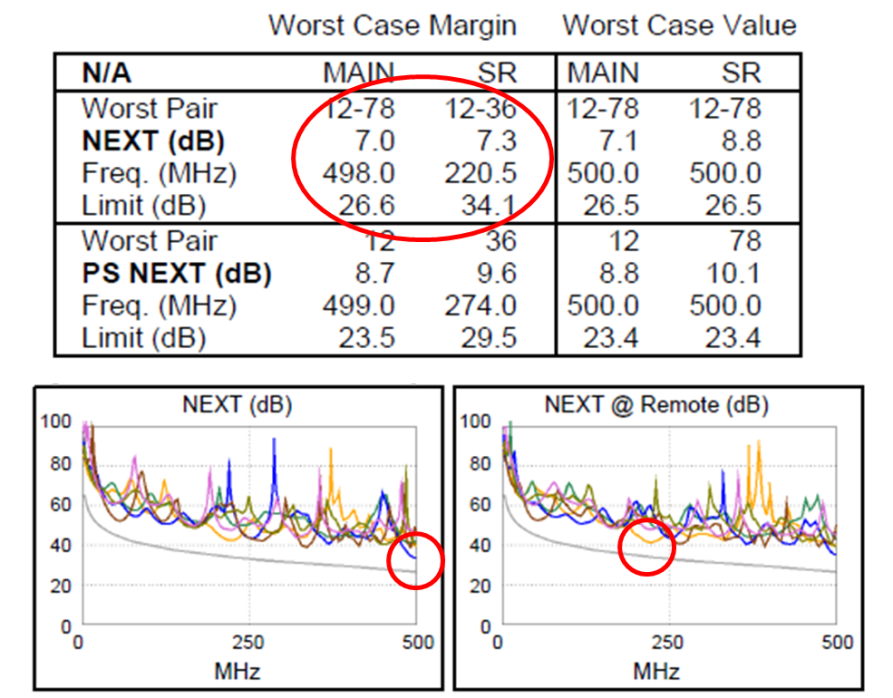 Worst Case Margin vs. Worst Case Value
Regardless of the parameter, the test report shows the worst case margin and values for both the main test unit (MAIN) and the smart remote unit (SR). But what is the difference?
Worst case margin is based on where the value came the closest to the limit line, which is what you should be most concerned about. Worst case value is the amount of margin at the point where the value was the worst overall but not in relation to the limit line. And because the tester looks for worst case margin and worst case value for all pairs and pair combinations, the worst case margin and worst case value might not be on the same pair. They can however be the same value on the same pair.
This report shows that the worst case NEXT margin for the main unit of 7 dB occurred between Pairs 1-2 and 7-8 at 498 MHz, while the worst case margin for the remote unit of 7.3 dB occurred at 220.5 MHz. Both of these can be seen in the graphical representation as the location where the line gets closest to the limit.
When It Fails
When a cable fails (and at some point it will), you'll see the distinguishable big red X in the top right corner of the LinkWare™ PC cable test management software and a test summary of FAIL. Thankfully, the report also tells you why--also in red so you don't miss it.
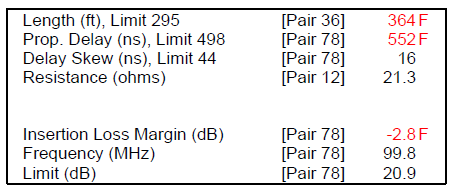 This report here clearly shows in red that the test failed for length limit, coming in at 364 ft instead of the 295-ft limit (this tester was set to feet instead of meters). It also shows failure for propagation delay and insertion loss (likely due to the excessive length).
Now that you know how to read your LinkWare reports, why not take advantage of LinkWare Live service that lets you upload test results from any location. It takes just a few minutes to set up, and it's free!
Publications récentes Tout voir >
Torons ou câbles rigides
2024-3-06
Qu’est-ce que la perte de retour ?
2023-2-14
Plus de publications générales Tout voir >
Torons ou câbles rigides
2024-3-06


©2006-2021 Fluke Corporation。保留所有权利。
RM2011, 20/F, SCITECH Tower, 22 Jianguomenwai Avenue, Chaoyang District, Beijing, China
地址:北京市朝阳区建国门外大街22号赛特大厦20层2011室
联系电话:400-8103435
沪ICP备11037028号-15![]()